
Apache Spark is incredibly powerful, but anyone who has worked with it long enough knows the feeling:
Why is this job suddenly slower today?
Why are executors running out of memory?
Why is one stage taking 90% of the runtime?
What exactly is Spark doing behind the scenes?
The Spark UI already provides a lot of useful information, but collecting, visualizing, and analyzing performance metrics at scale often requires additional tooling.
Over the years, we have developed and open-sourced a set of complementary tools to help Spark users monitor, troubleshoot, and better understand their workloads from notebooks to production clusters.
In this post, we present the three Spark monitoring tools we publish and actively use at CERN.
Three Different Tools, Three Different Perspectives on Spark
Each tool addresses a different layer of Spark observability:
| Tool | Main Goal |
|---|---|
| sparkMeasure | Capture and analyze Spark performance metrics programmatically |
| SparkMonitor | Improve visibility and usability inside notebooks |
| Spark Dashboard | Build real-time monitoring dashboards and historical observability |
Together, they form a lightweight but powerful ecosystem for Spark monitoring and troubleshooting.
1. sparkMeasure — Understand What Your Spark Job Is Really Doing
Project
sparkMeasure GitHub Repository and API documentation
If you use Spark interactively, tune jobs, or benchmark workloads, chances are you have wished for an easier way to collect performance metrics directly from your code.
That is exactly what sparkMeasure was built for.
sparkMeasure provides lightweight instrumentation for Apache Spark applications and exposes metrics directly inside Scala and PySpark workflows.
Why Users Like It
One major advantage of sparkMeasure is simplicity.
A few lines of code are enough to start collecting meaningful metrics.
Example Use Cases
- Compare two DataFrame/SQL optimization strategies
- Investigate shuffle-heavy workloads
- Measure the impact of partitioning changes
- Capture metrics during automated tests
- Export performance summaries to DataFrames
Adoption
sparkMeasure has seen strong adoption in the Spark community. The sparkMeasure's Python wrapper package alone currently (May 2026) exceeds 1 million downloads per month. This level of usage demonstrates how broadly useful lightweight Spark instrumentation has become.

Figure 1: Architecture diagram showing how sparkMeasure integrates with the Spark's executors task metrics system to collect, aggregate, and expose Spark execution metrics for analysis and troubleshooting.
2. SparkMonitor — Making Spark Friendlier in Notebooks
Project
sparkmonitor GitHub Repository
Interactive notebooks are one of the most popular ways to use Spark today.
But notebook users often struggle with:
- limited visibility into job progress,
- difficulty understanding Spark execution,
- and poor feedback during long-running computations.
This is where sparkmonitor helps.
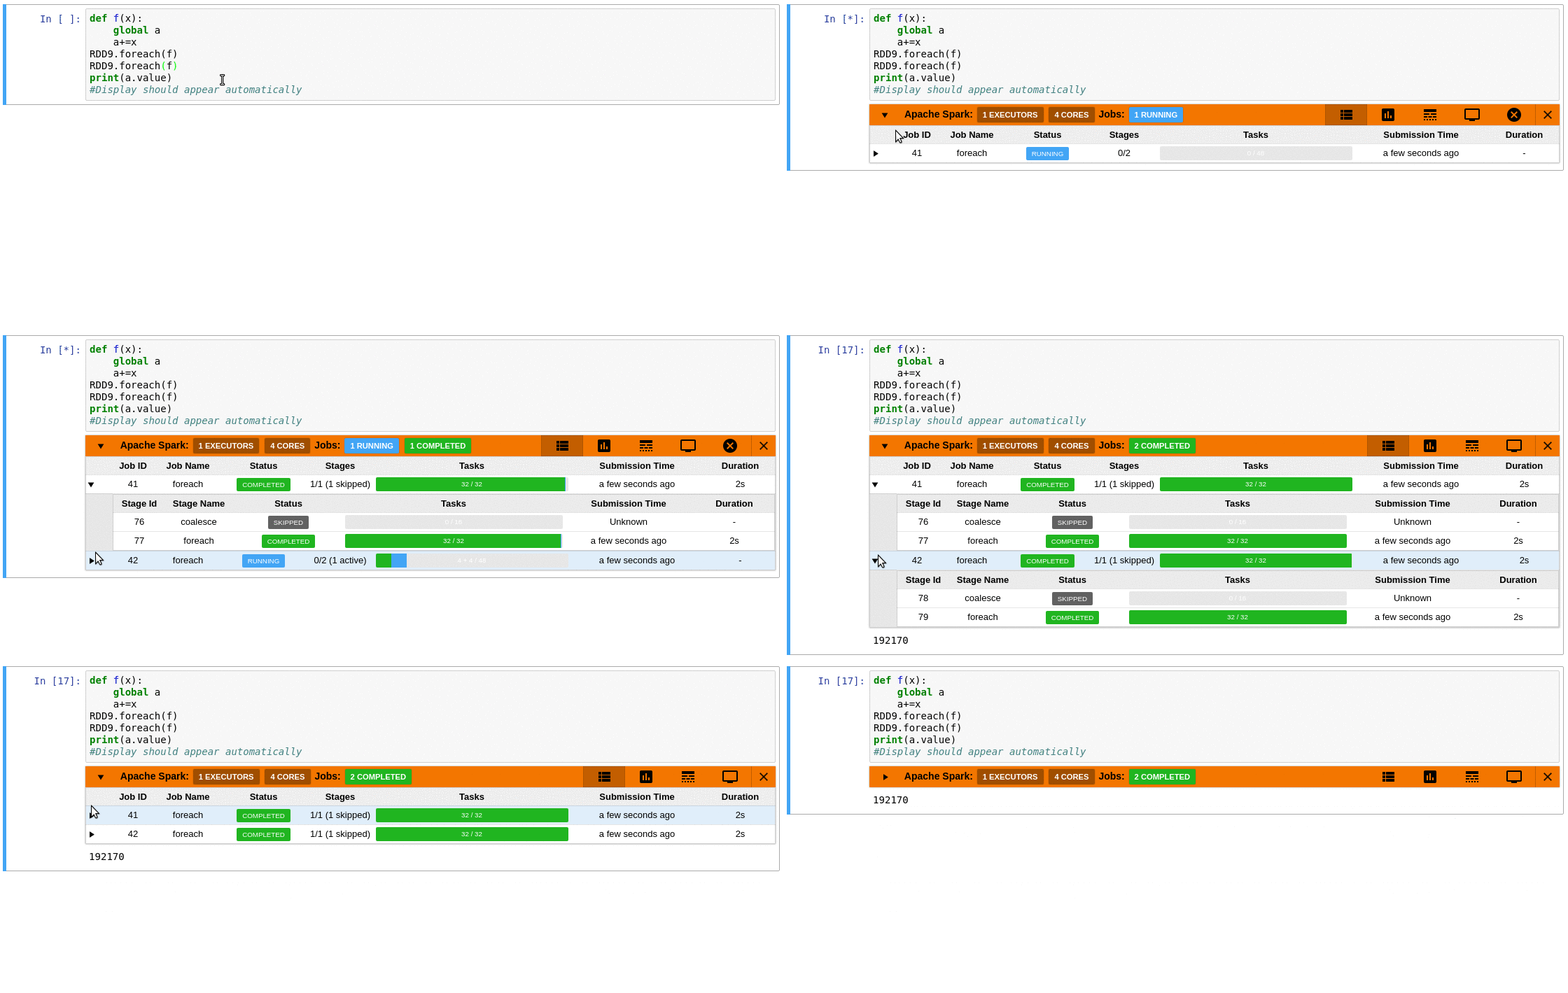
SparkMonitor was originally developed for CERN’s hosted notebook environments to improve the Spark experience for users running Jupyter notebooks interactively.
It provides notebook-friendly monitoring and visualization capabilities that make Spark behavior easier to understand while jobs are running.
The goal is simple:
Make Spark execution more transparent and easier to follow directly from the notebook environment.
3. Spark Dashboard — Real-Time Observability for Spark Clusters
Project
Spark Dashboard GitHub Repository and notes on Spark Dashboard
Sometimes the Spark UI or aggregated Spark metrics are not enough to understand resource usage, saturation or performance bottlenecks.
Operations teams and platform administrators need real-time monitoring and historical metrics,
This is the goal of the Spark Dashboard project.
Why This Matters
Real-time dashboards help answer operational questions such as:
- Are executors under memory pressure or CPU bound or I/O bound?
- Is the cluster saturated?
- Did a deployment introduce regressions?
At CERN, this dashboard is also used internally as an optional enhanced monitoring solution for Spark services.
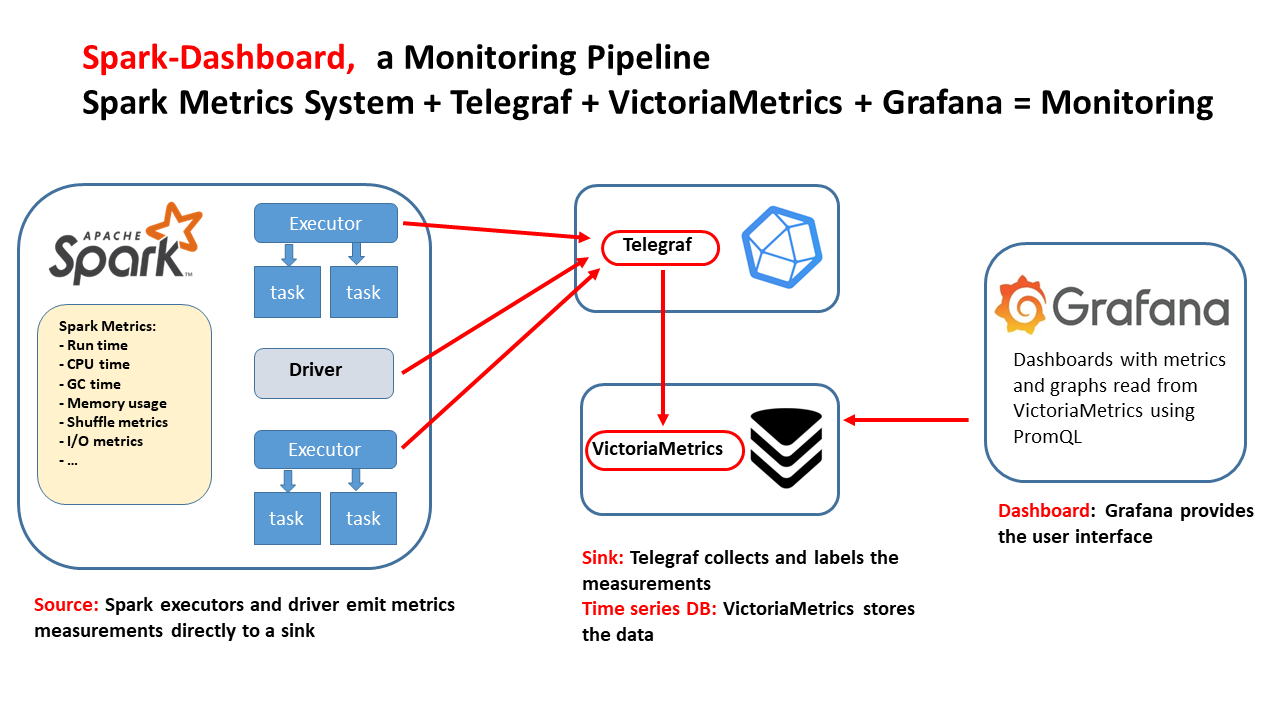
The goal of Spark Dashboard is to provide a ready-to-use real-time monitoring stack for Spark, packaged as Docker images and Helm charts, with integrations already configured for Telegraf, VictoriaMetrics, and Grafana dashboards.
This makes it easy to deploy end-to-end Spark observability, from a laptop to large Kubernetes clusters.
Test-Driving the Monitoring Tools with TPC-DS Benchmarks
A practical way to explore and validate these monitoring tools is to run them against reproducible Spark benchmark workloads such as TPC-DS.
We use an open-source PySpark wrapper for TPC-DS benchmark execution: TPCDS PySpark Wrapper
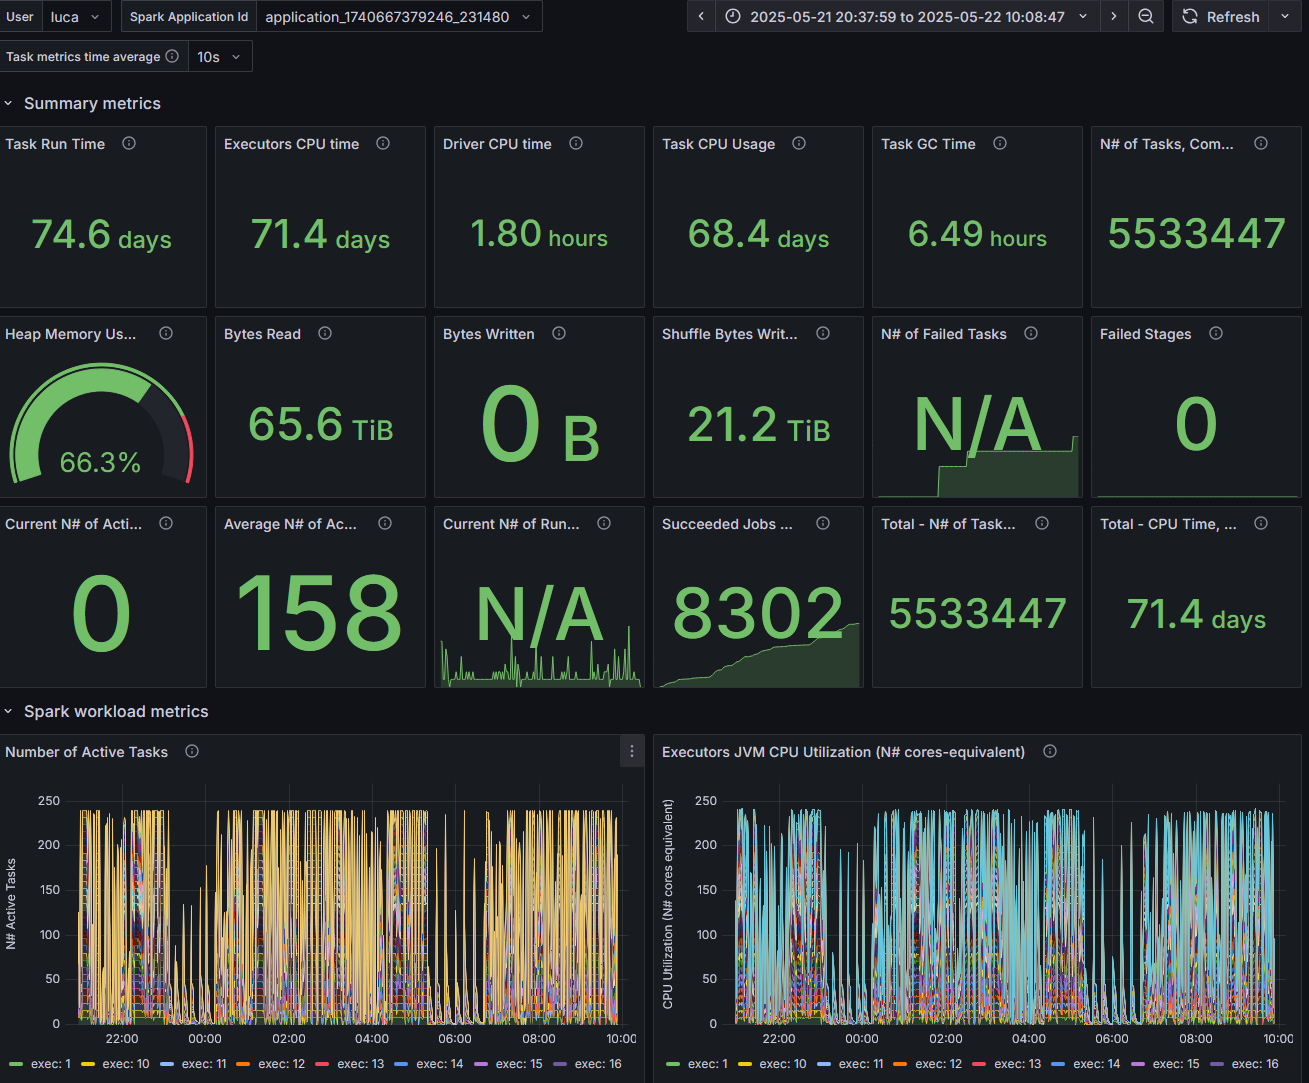
Figure 4: Snapshot from the Spark Dashboard captured during the execution of the TPC-DS benchmark at 10 TB scale, illustrating real-time cluster activity and Spark resource utilization.
Complementary Rather Than Competing
These tools are designed to work at different levels. Think of them as complementary building blocks.
Open Source and Community
All three projects are open source and publicly available on GitHub.
Repositories
Final Thoughts
Spark applications can sometimes feel like black boxes.
The more visibility users have into execution behavior, metrics, and resource consumption, the easier it becomes to:
- optimize workloads,
- troubleshoot issues,
- improve cluster efficiency,
- and teach others how Spark really works.
We hope these tools help make Spark more observable, understandable, and easier to operate, whether you are running a single notebook or a large production platform.
If you are already using them, we would love to hear about your use cases and feedback from the community.