
Tag: event
-

Troubleshoot I/O & Wait Latency with OraLatencyMap and PyLatencyMap
Troubleshoot I/O & Wait Latency with OraLatencyMap and PyLatencyMap I recently chased an Oracle performance issue where most reads were sub-millisecond (cache), but a thin band around ~10 ms (spindles) dominated total wait time. Classic bimodal latency: the fast band looked fine in averages, yet the rare slow band owned the delay. To investigate, and
-

CERN PGDay 2025 is here!
CERN PGDay 2025 is here! CERN PGDay 2025 builds on the experience of past PostgreSQL events at CERN and a newly established collaboration with SwissPUG. It will create an opportunity for PostgreSQL users and enthusiasts to meet in the French-speaking part of Switzerland in order to network and exchange their experiences. We plan to turn
-
Enhancing Apache Spark Performance with Flame Graphs: A Practical Example Using Grafana Pyroscope
Enhancing Apache Spark Performance with Flame Graphs: A Practical Example Using Grafana Pyroscope TL;DR Explore a step-by-step example of troubleshooting Apache Spark job performance using flame graph visualization and profiling. Discover the seamless integration of Grafana Pyroscope with Spark for streamlined data collection and visualization. The Puzzle of the Slow Query Set within the framework
-
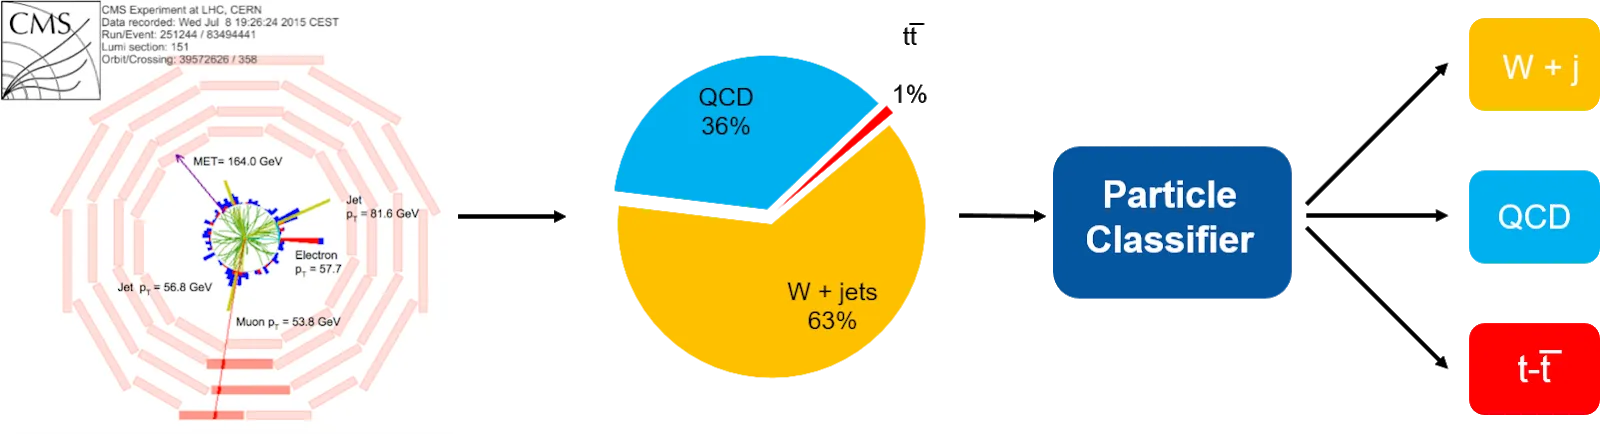
Machine Learning Pipelines for High Energy Physics Using Apache Spark with BigDL and Analytics Zoo
Machine Learning Pipelines for High Energy Physics Using Apache Spark with BigDL and Analytics Zoo Topic: This post describes a data pipeline for a machine learning task of interest in high energy physics: building a particle classifier to improve event selection at the particle detectors. The pipeline is built using tools from the “Big Data
-
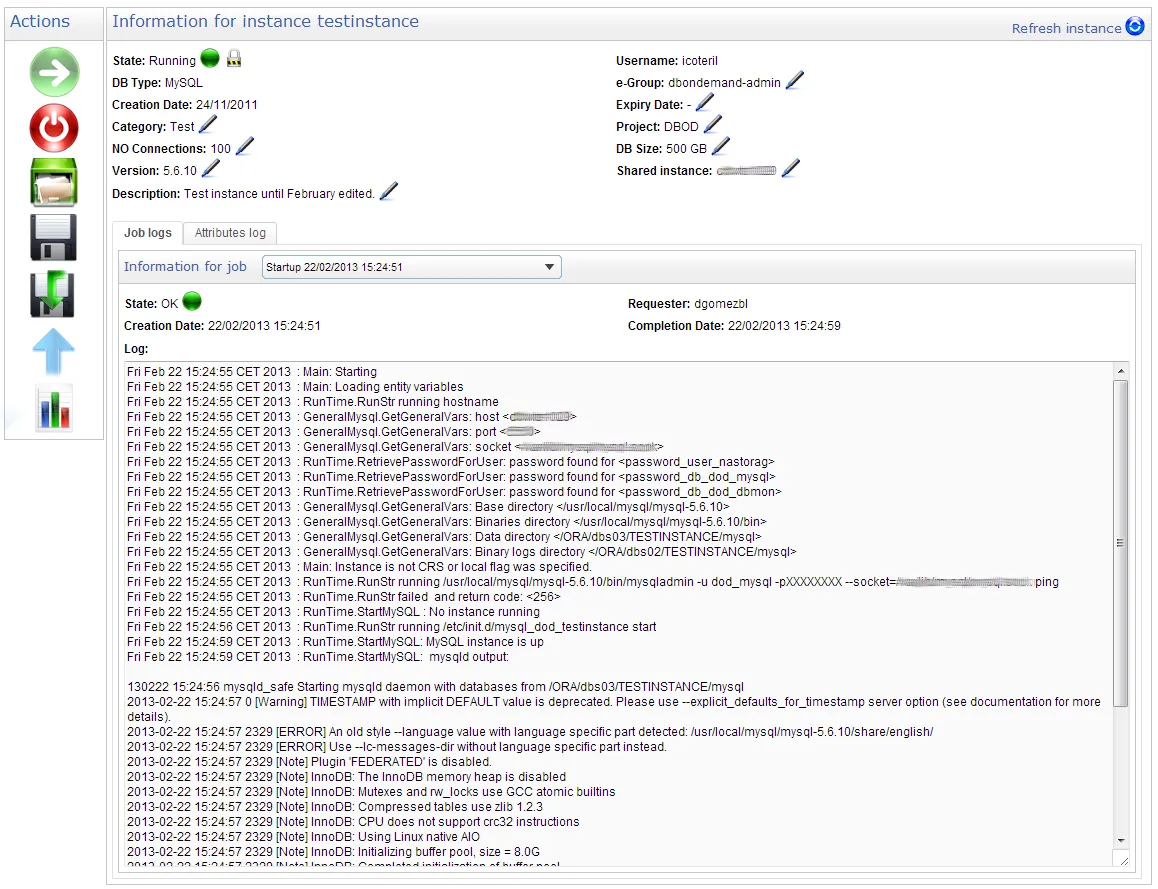
A new web application for the DBOD service
A new web application for the DBOD service Introduction The DBOD service maintains a web interface allowing “database on demand” users to carry out ordinary tasks without intervention of the administrators. It is with a view to ergonomy, but above all to modularity and scalability, that a complete redesign of this application has been initiated.
-
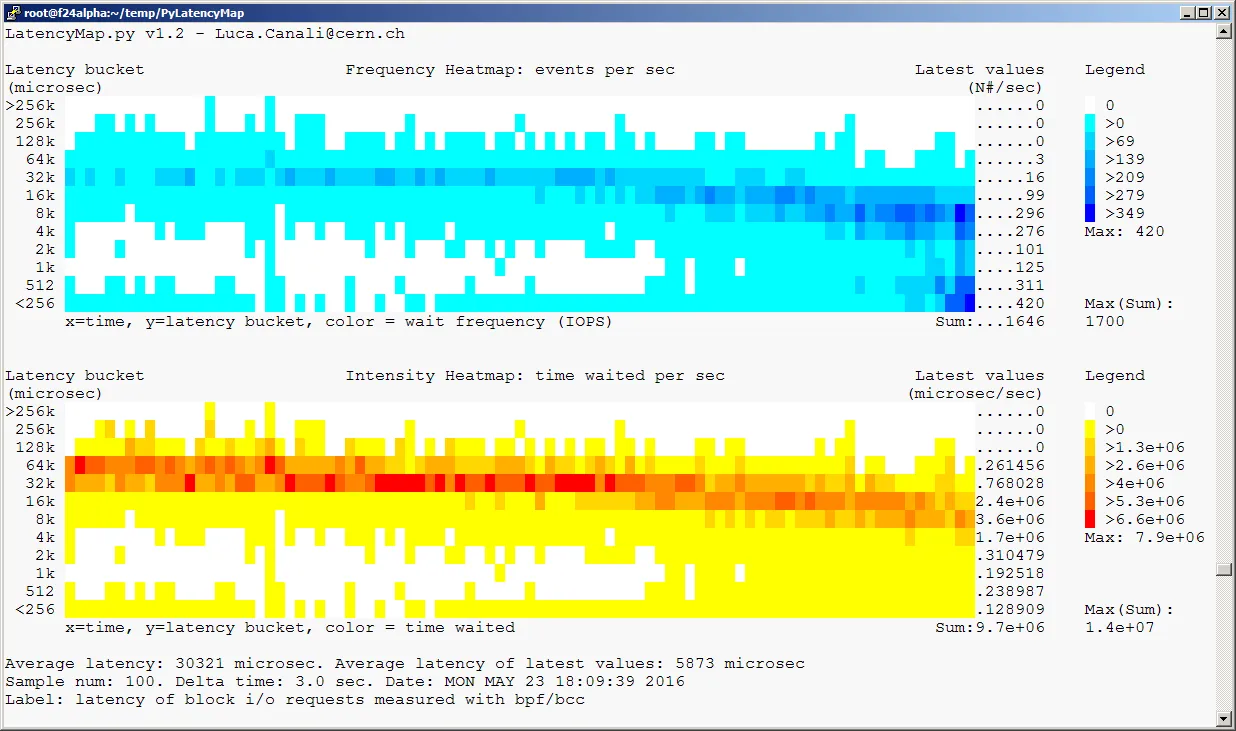
Linux BPF/bcc for Oracle Tracing
Linux BPF/bcc for Oracle Tracing Topic: In this post you will find a short discussion and pointers to the code of a few sample scripts that I have written using Linux BPF/bcc and uprobes for Oracle tracing. Previous work and motivations Tools for dynamic tracing are very useful for troubleshooting and internals investigations of Oracle
-
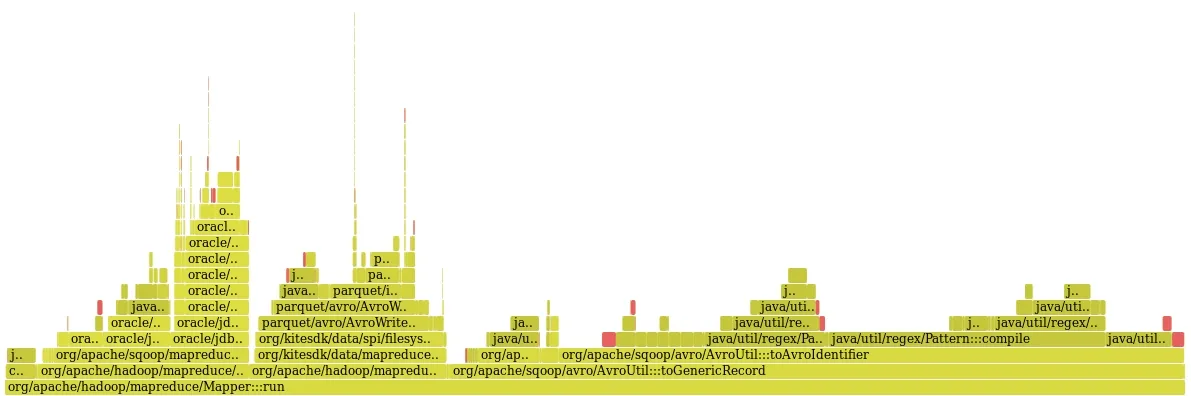
Hadoop performance troubleshooting with stack tracing, an introduction.
Hadoop performance troubleshooting with stack tracing, an introduction. Topic: This post is about profiling and performance tuning of distributed workloads and in particular Hadoop applications. You will learn of a profiler application we have developed and how it has successfully been applied to tuning Sqoop to improve the throughput of data transfer from Oracle to
-
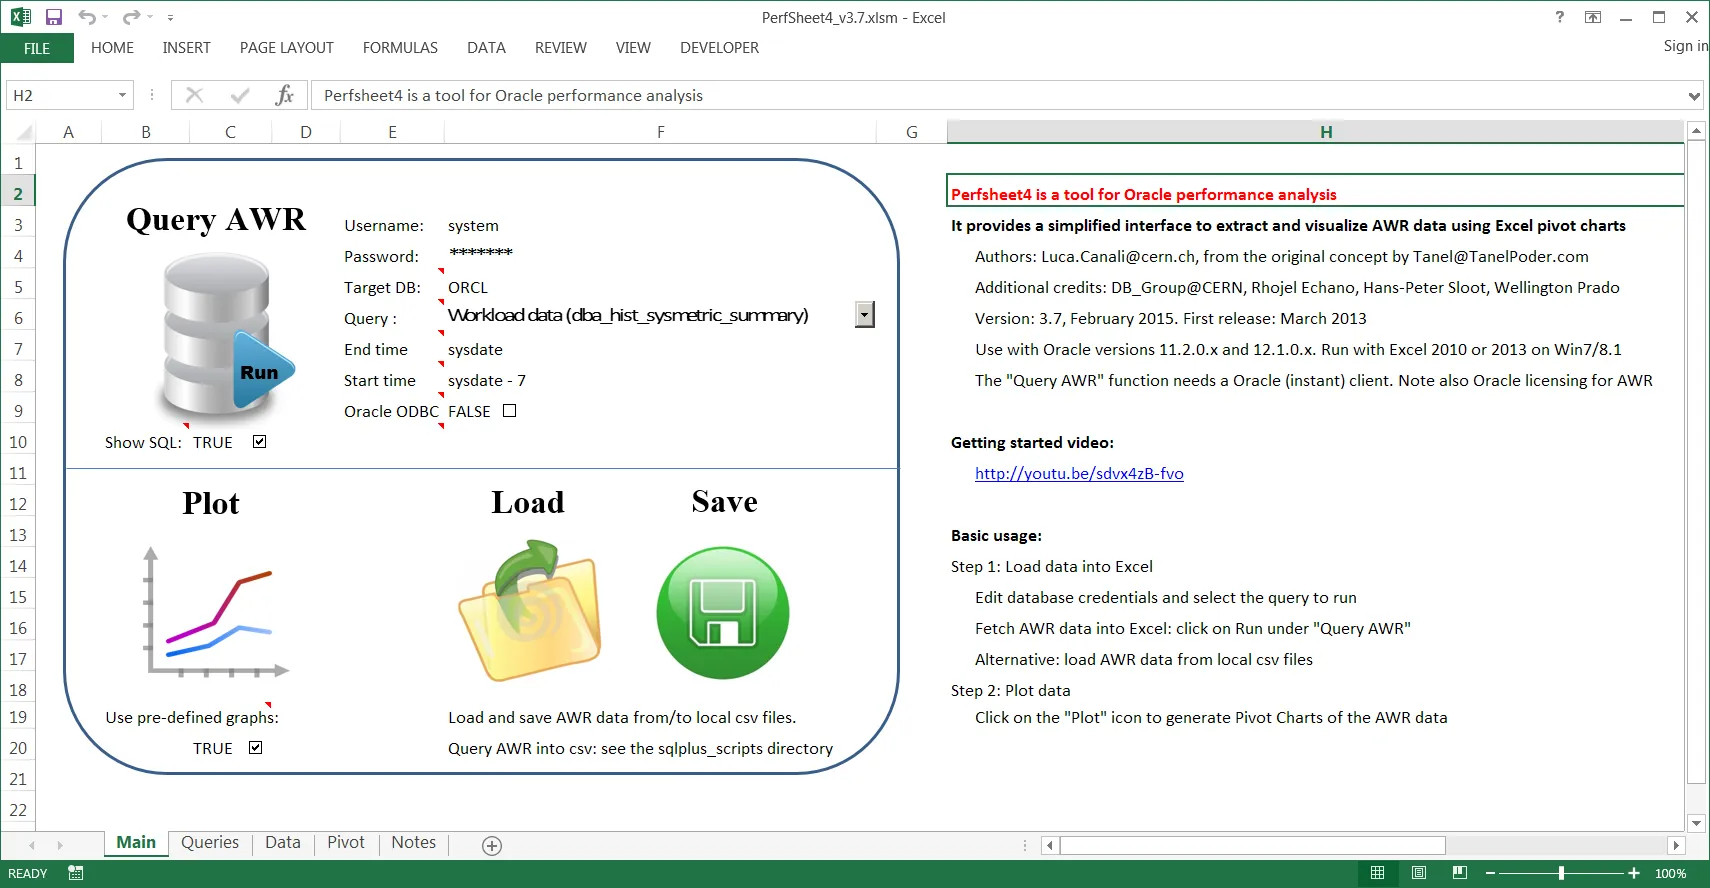
Latest updates to PerfSheet4, a tool for Oracle AWR data mining and visualization
Latest updates to PerfSheet4, a tool for Oracle AWR data mining and visualization Topic: This post is about the latest updates to PerfSheet4 v3.7 (February 2015). PerfSheet4 is a tool aimed at DBAs and Oracle performance analysts. It provides a simplified interface to extract and visualize AWR time series data using Excel pivot charts. Why
-
Flame Graphs for Oracle
Flame Graphs for Oracle Topic: This post is a hands-on introduction to using on-CPU Flame Graphs for investigating Oracle workloads. This technique is about collecting and visualizing sampled stack trace data to analyze and troubleshoot Oracle processes at the OS level (in particular applied to Linux). Motivations: The techniques and tools described here can be
-
A Closer Look at CALIBRATE_IO
A Closer Look at CALIBRATE_IO Topic: This blog entry is about investigating Oracle’s DBMS_RESOURCE_MANAGER.CALIBRATE_IO Spoiler: For quantitative analysis of storage performance and in particular for measuring random read I/O in Oracle, I’d rather advise the use tools that allow generating test workloads in a controlled manner, in a way that can be understood and measured