
Tag: flame graph
-

Enhancing Apache Spark Performance with Flame Graphs: A Practical Example Using Grafana Pyroscope
Enhancing Apache Spark Performance with Flame Graphs: A Practical Example Using Grafana Pyroscope TL;DR Explore a step-by-step example of troubleshooting Apache Spark job performance using flame graph visualization and profiling. Discover the seamless integration of Grafana Pyroscope with Spark for streamlined data collection and visualization. The Puzzle of the Slow Query Set within the framework
-

Performance Analysis of a CPU-Intensive Workload in Apache Spark
Performance Analysis of a CPU-Intensive Workload in Apache Spark Topic: This post is about techniques and tools for measuring and understanding CPU-bound and memory-bound workloads in Apache Spark. You will find examples applied to studying a simple workload consisting of reading Apache Parquet files into a Spark DataFrame. Why are the topics discussed here relevant
-
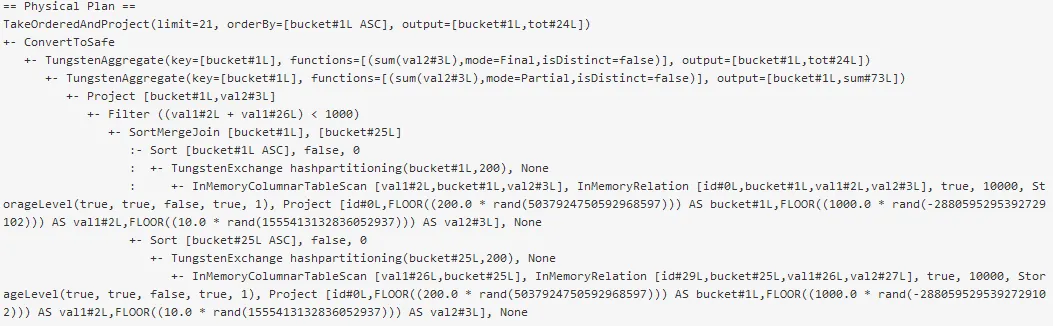
Apache Spark 2.0 Performance Improvements Investigated With Flame Graphs
Apache Spark 2.0 Performance Improvements Investigated With Flame Graphs Topic: This post is about performance optimizations introduced in Apache Spark 2.0, in particular whole-stage code generation. A test case is introduced and investigated with diagnostic tools. Introduction: performance troubleshooting of a slow query using parallel query execution in a Hadoop cluster The idea for this
-
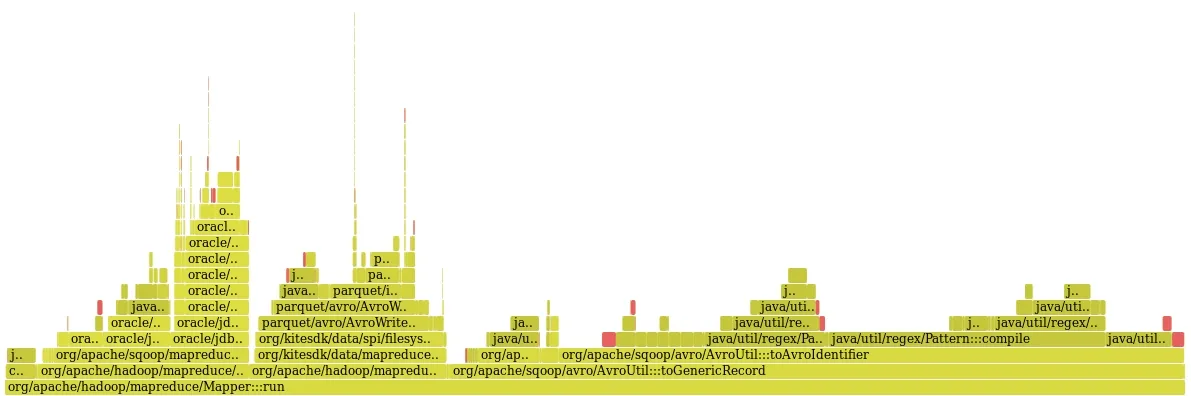
Hadoop performance troubleshooting with stack tracing, an introduction.
Hadoop performance troubleshooting with stack tracing, an introduction. Topic: This post is about profiling and performance tuning of distributed workloads and in particular Hadoop applications. You will learn of a profiler application we have developed and how it has successfully been applied to tuning Sqoop to improve the throughput of data transfer from Oracle to
-
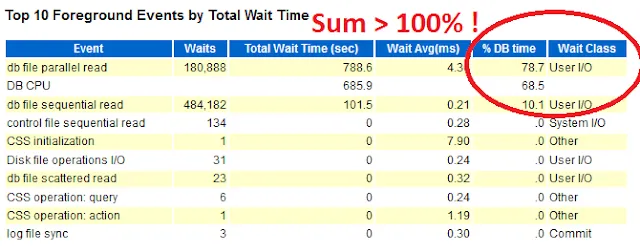
Oracle Wait Events Investigated With Extended Stack Profiling and Flame Graphs
Oracle Wait Events Investigated With Extended Stack Profiling and Flame Graphs Topic: this post is about investigating Oracle wait events using stack profiles and flame graphs extended with OS-process state and Oracle wait event details. Context: The case of the DB Time > CPU Time + Wait Time Oracle instrumentation provides wait event and CPU
-
Scaling up Cardinality Estimates in 12.1.0.2
Scaling up Cardinality Estimates in 12.1.0.2 Topic: Counting the number of distinct values (NDV) for a table column has important applications in the database domain, ranging from query optimization to optimizing reports for large data warehouses. However the legacy SQL method of using SELECT COUNT (DISTINCT <COL>) can be very slow. This is a well
-
Oracle Optimizer Investigated with Flame Graphs
Oracle Optimizer Investigated with Flame Graphs Topic: This post is about investigating the Oracle Optimizer using stack sampling and flame graphs. We will see how the complexity of the Optimizer has increased over the years and in particular with the introduction of cost-based optimization and more recently with 12c adaptive optimization. Context and goal: Stack
-
Flame Graphs for Oracle
Flame Graphs for Oracle Topic: This post is a hands-on introduction to using on-CPU Flame Graphs for investigating Oracle workloads. This technique is about collecting and visualizing sampled stack trace data to analyze and troubleshoot Oracle processes at the OS level (in particular applied to Linux). Motivations: The techniques and tools described here can be