
Tag: Perf
-

Performance Analysis of a CPU-Intensive Workload in Apache Spark
Performance Analysis of a CPU-Intensive Workload in Apache Spark Topic: This post is about techniques and tools for measuring and understanding CPU-bound and memory-bound workloads in Apache Spark. You will find examples applied to studying a simple workload consisting of reading Apache Parquet files into a Spark DataFrame. Why are the topics discussed here relevant
-
Linux BPF/bcc for Oracle Tracing
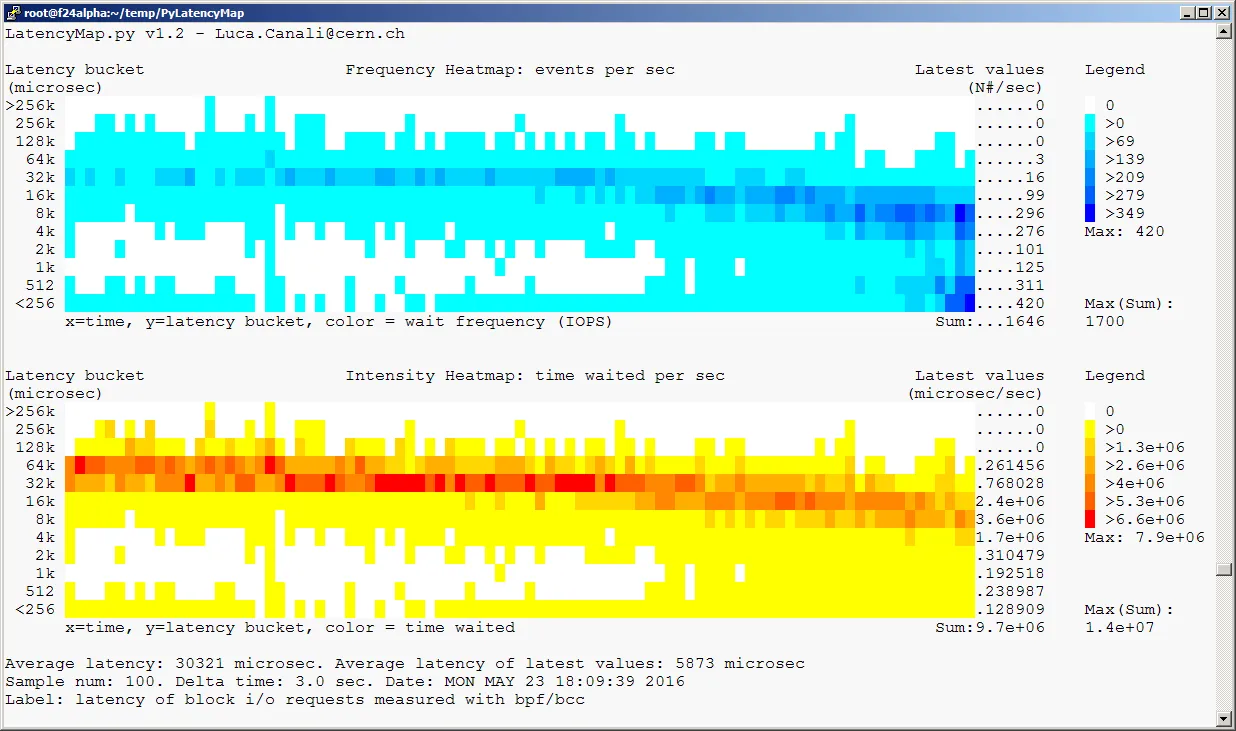
Linux BPF/bcc for Oracle Tracing Topic: In this post you will find a short discussion and pointers to the code of a few sample scripts that I have written using Linux BPF/bcc and uprobes for Oracle tracing. Previous work and motivations Tools for dynamic tracing are very useful for troubleshooting and internals investigations of Oracle
-
Hadoop performance troubleshooting with stack tracing, an introduction.
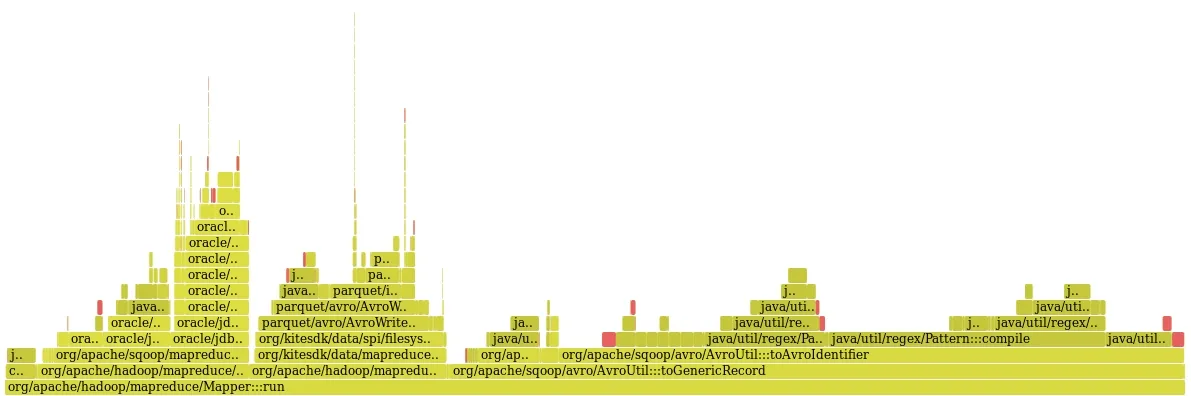
Hadoop performance troubleshooting with stack tracing, an introduction. Topic: This post is about profiling and performance tuning of distributed workloads and in particular Hadoop applications. You will learn of a profiler application we have developed and how it has successfully been applied to tuning Sqoop to improve the throughput of data transfer from Oracle to
-

Linux Perf Probes for Oracle Tracing
Linux Perf Probes for Oracle Tracing Topic: this post is about Linux perf and uprobes for tracing and profiling Oracle workloads for advanced troubleshooting. Context The recent progress and maturity of some of the Linux dynamic tracing tools has raised interest in applying these techniques to Oracle troubleshooting and performance investigations. See Brendan Gregg‘s web
-
Flame Graphs for Oracle
Flame Graphs for Oracle Topic: This post is a hands-on introduction to using on-CPU Flame Graphs for investigating Oracle workloads. This technique is about collecting and visualizing sampled stack trace data to analyze and troubleshoot Oracle processes at the OS level (in particular applied to Linux). Motivations: The techniques and tools described here can be