
Tag: Performance
-
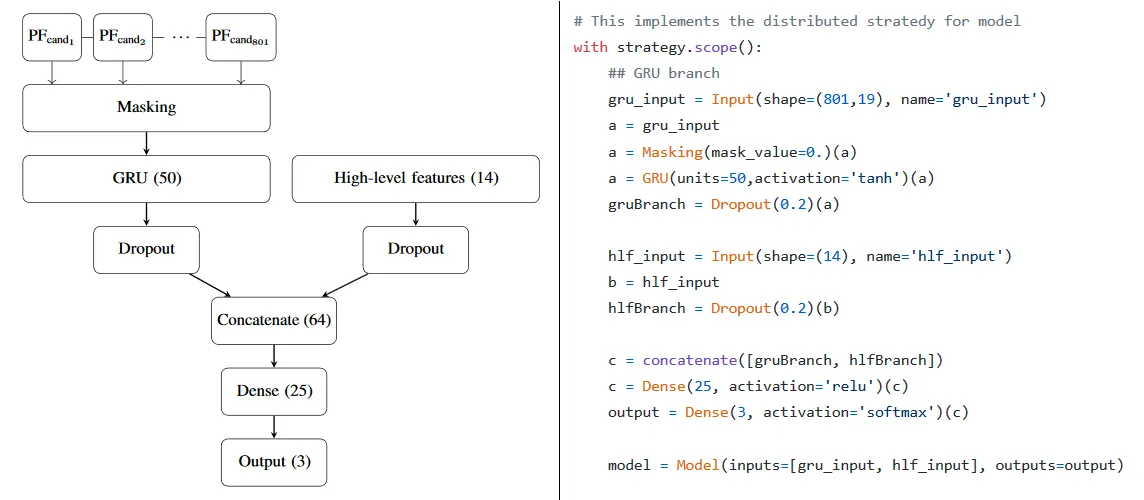
Distributed Deep Learning for Physics with TensorFlow and Kubernetes
Distributed Deep Learning for Physics with TensorFlow and Kubernetes Summary: This post details a solution for distributed deep learning training for a High Energy Physics use case, deployed using cloud resources and Kubernetes. You will find the results for training using CPU and GPU nodes. This post also describes an experimental tool that we developed,
-
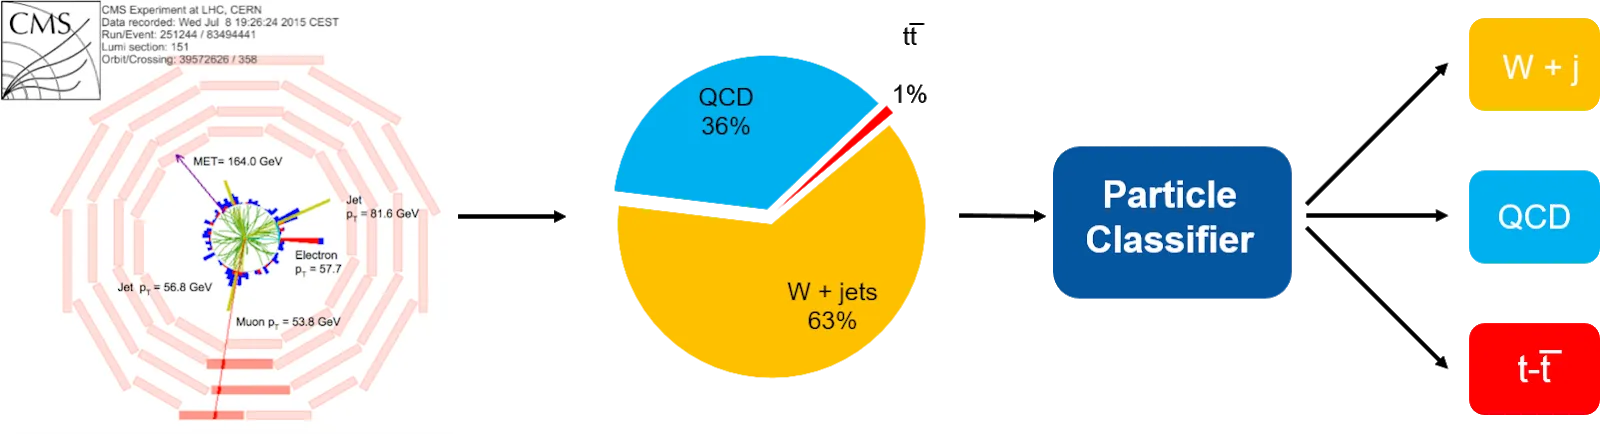
Machine Learning Pipelines for High Energy Physics Using Apache Spark with BigDL and Analytics Zoo
Machine Learning Pipelines for High Energy Physics Using Apache Spark with BigDL and Analytics Zoo Topic: This post describes a data pipeline for a machine learning task of interest in high energy physics: building a particle classifier to improve event selection at the particle detectors. The pipeline is built using tools from the “Big Data
-
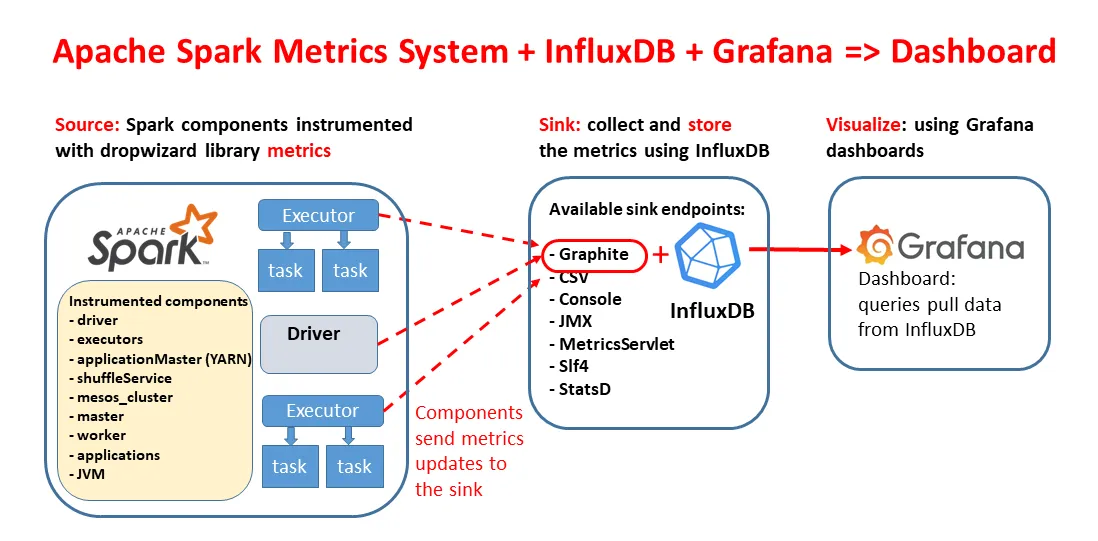
A Performance Dashboard for Apache Spark
A Performance Dashboard for Apache Spark Topic: This post dives into the steps for deploying a performance dashboard for Apache Spark, using Spark metrics system instrumentation, InfluxDB and Grafana. What problem does it solve: The dashboard can provide important insights for performance troubleshooting and online monitoring of Apache Spark workloads. In particular when running Spark
-

Performance Analysis of a CPU-Intensive Workload in Apache Spark
Performance Analysis of a CPU-Intensive Workload in Apache Spark Topic: This post is about techniques and tools for measuring and understanding CPU-bound and memory-bound workloads in Apache Spark. You will find examples applied to studying a simple workload consisting of reading Apache Parquet files into a Spark DataFrame. Why are the topics discussed here relevant
-

PerfSheet.js: Oracle AWR Data Visualization in the Browser with JavaScript Pivot Charts
PerfSheet.js: Oracle AWR Data Visualization in the Browser with JavaScript Pivot Charts PerfSheet.js is a tool aimed at DBAs and Oracle performance analysts. It provides a simplified interface to extract and visualize AWR time series data in the browser using javascript. The reason for a tool like PerfSheet.js is to make the analysis of AWR
-
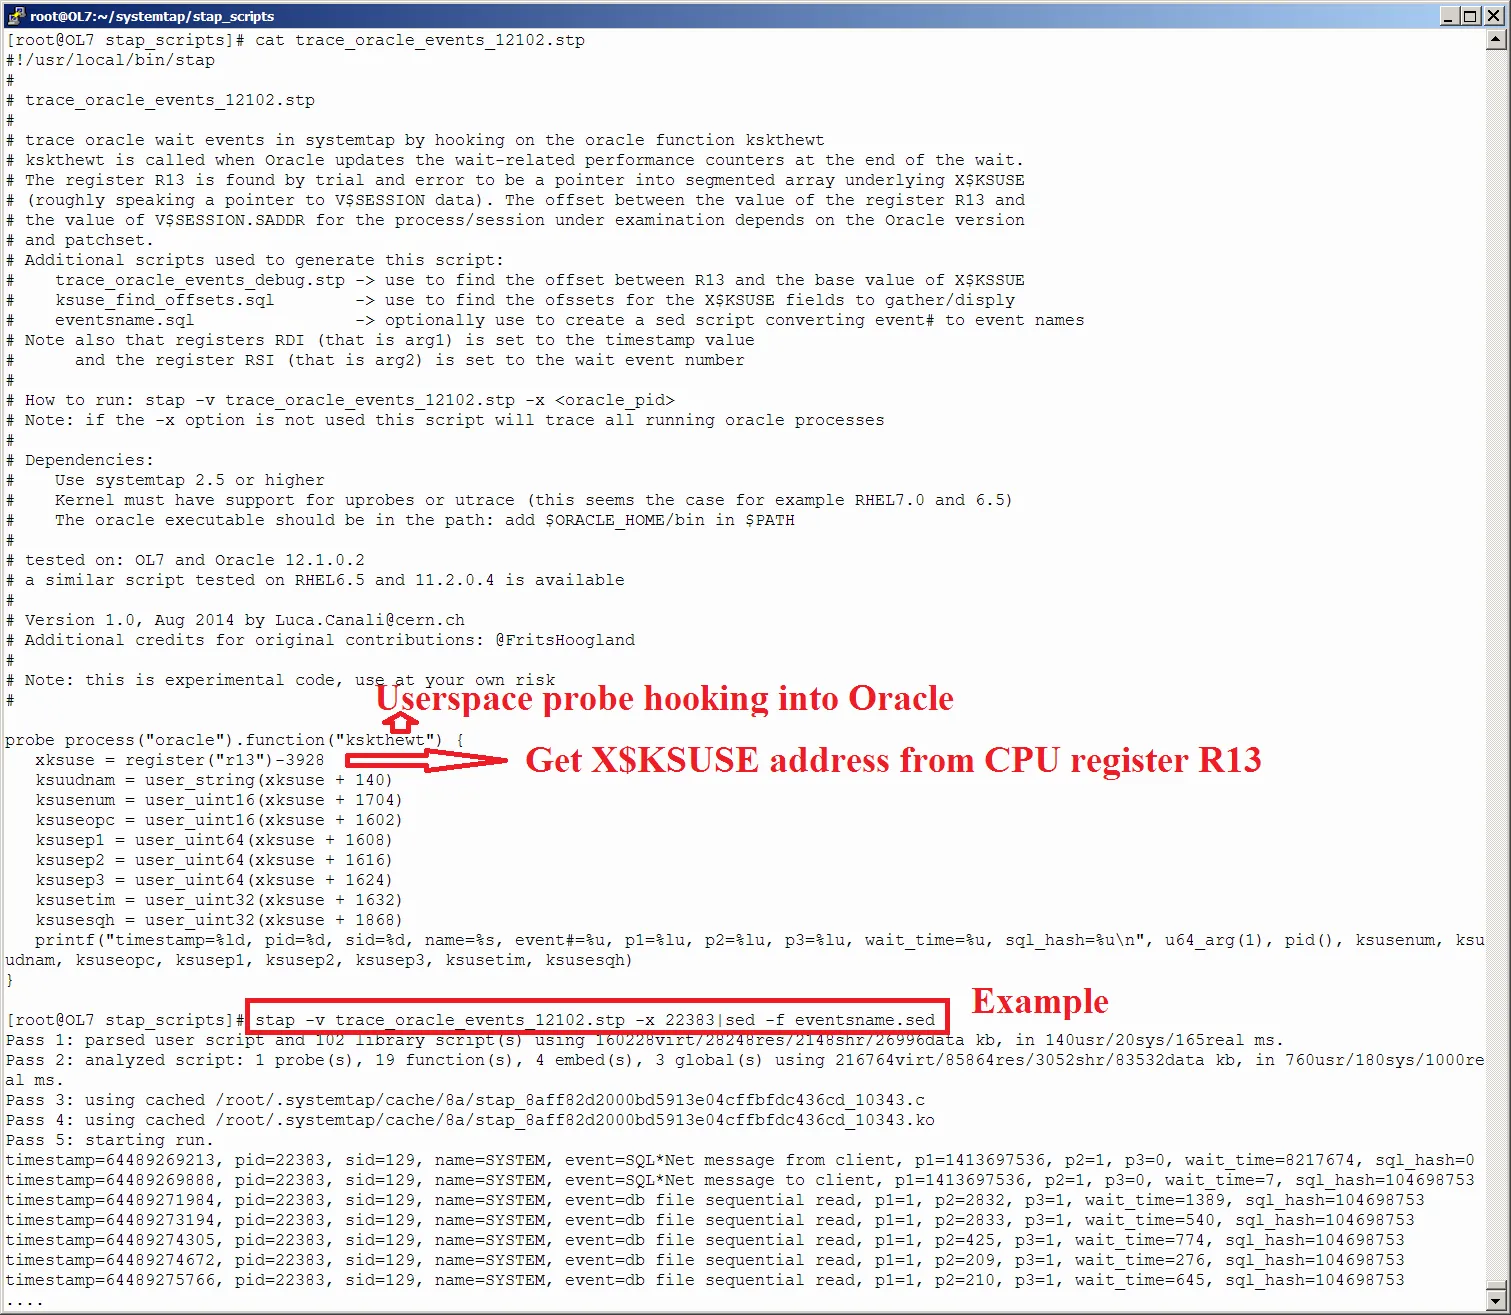
SystemTap into Oracle
SystemTap into Oracle Topic: This post is about using SystemTap for investigating and troubleshooting Oracle RDBMS. In particular you will learn how to probe Oracle processes and their userspace functions. These techniques aim to be useful as well as fun to learn for those keen into peeking under the hood of the technology and improve