TLDR; Apache Spark 3.0 comes with many improvements, including new features for memory monitoring. This can help you troubleshooting memory usage and optimizing the memory configuration of your Spark jobs for better performance and stability, see SPARK-23429 and SPARK-27189.
The problem with memory
Memory is key for the performance and stability of Spark jobs. If you don't allocate enough memory for your Spark executors you are more likely to run into the much dreaded Java OOM (out of memory) errors or substantially degrade your jobs' performance. Memory is needed by Spark to execute efficiently Dataframe/RDD operations, and for improving the performance of algorithms that would otherwise have to swap to disk in their processing (e.g. shuffle operations), moreover, it can be used for caching data, reducing I/O. This is all good in theory, but in practice how do you know how much memory you need?
A basic solution
One first basic approach to memory sizing for Spark jobs, is to start by giving the executors ample amounts of memory, provided your systems has enough resources. For example, by setting the spark.executor.memory configuration parameter to several GBs. Note, in local mode you would set spark.driver.memory instead. You can further tune the configuration by trial-and-error, by reducing and increasing memory with each test and observe the results. This approach may give good results quickly, but it is not a very solid approach to the problem.
A more structured approach to memory usage troubleshooting and to sizing memory for Spark jobs is to use monitoring data to understand how much memory is used by the Spark application, which jobs request more memory, and which memory areas are used, finally linking this back to the application details and in the context of other resources utilization (for example, CPU usage).
This approach helps with drilling down on issues of OOM, and also to be more precise in allocating memory for Spark applications, aiming at using just enough memory as needed, without wasting memory that can be a scarce shared resource in some systems. It is still an experimental and iterative process, but more informed than the basic trial-and-error solution.
How memory is allocated and used by Spark
Configuration of executor memory
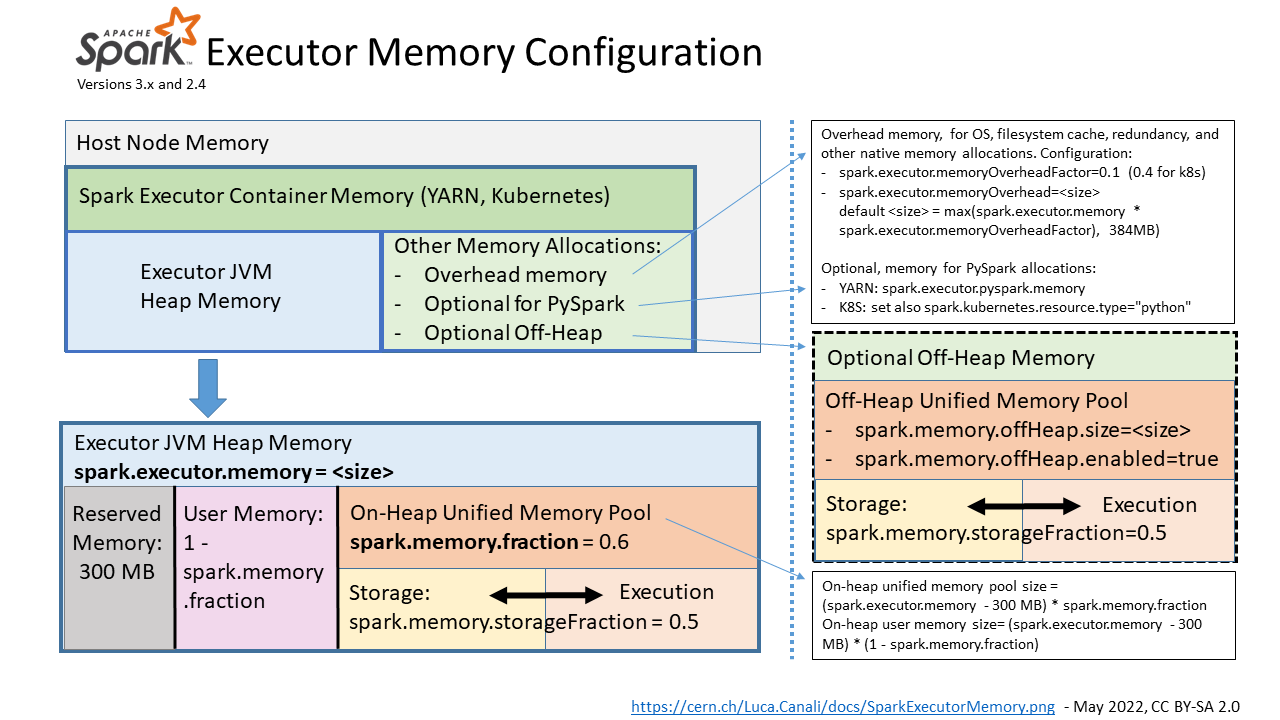
The main configuration parameter used to request the allocation of executor memory is spark.executor.memory.Spark running on YARN, Kubernetes or Mesos, adds to that a memory overhead to cover for additional memory usage (OS, redundancy, filesystem cache, off-heap allocations, etc), which is calculated as memory_overhead_factor * spark.executor.memory (with a minimum of 384 MB). The overhead factor is 0.1 (10%), it and can be configured when running on Kubernetes (only) using spark.kubernetes.memoryOverheadFactor.
When using PySpark additional memory can be allocated using spark.executor.pyspark.memory.
Additional memory for off-heap allocation is configured using
spark.memory.offHeap.size=<size> and
spark.memory.offHeap.enabled=true. This works on YARN, for K8S, see
SPARK-32661. Note also parameters for driver memory allocation: spark.driver.memory and spark.driver.memoryOverhead.
Note: this discussion covers recent versions of Spark at the time of this writing, notably Spark 3.0 and 2.4. See also
Spark documentation.
Figure 1: Pictorial representation of the memory areas allocated and used by Spark executors and the main parameters for their configuration.
Spark unified memory pool
Spark tasks allocate memory for execution and storage from the JVM heap of the executors using a unified memory pool managed by the
Spark memory management system.
Unified memory occupies by default 60% of the JVM heap: 0.6 * (
spark.executor.memory - 300 MB). The factor 0.6 (60%) is the default value of the configuration parameter
spark.memory.fraction. 300MB is a hard-coded value of "reserved memory". The rest of the memory is used for user data structures, internal metadata in Spark, and safeguarding against OOM errors.
Spark manages execution and storage memory requests using the unified memory pool. When little execution memory is used, storage can acquire most of the available memory and vice versa. Additional structure in the working of the storage and execution memory is exposed with the configuration parameter spark.memory.storageFraction (default is 0.5), which guarantees that the stored blocks will not be evicted from the unified memory by execution below the specified threshold.
The unified memory pool can optionally be allocated using off-heap memory, the relevant configuration parameters are: spark.memory.offHeap.size and spark.memory.offHeap.enabled.
Opportunities for memory configuration settings
The first key configuration to get right is spark.executor.memory. Monitoring data (see the following paragraphs) can help you understand if you need to increase the memory allocated to Spark executors and or if you are already allocating plenty of memory and can consider reducing the memory footprint.
There are other memory-related configuration parameters that may need some adjustments for specific workloads: this can be analyzed and tested using memory monitoring data.
In particular, increasing spark.memory.fraction (default is 0.6) may be useful when deploying large Java heap, as there is a chance that you will not need to set aside 40% of the JVM heap for user memory. With similar reasoning, when using large Java heap allocation, manually setting spark.executor.memoryOverhead to a value lower than the default (0.1 * spark.executor.memory) can be tested.
Memory monitoring improvements in Spark 3.0
Two notable improvements in Spark 3.0 for memory monitoring are:
- SPARK-23429: Add executor memory metrics to heartbeat and expose in executors REST API
- see also the umbrella ticket SPARK-23206: Additional Memory Tuning Metrics
- SPARK-27189: Add Executor metrics and memory usage instrumentation to the metrics system
When troubleshooting memory usage it is important to investigate how much memory was used as the workload progresses and
measure peak values of memory usage. Peak values are particularly important, as this is where you get possible slow downs or even OOM errors. Spark 3.0 instrumentation adds monitoring data on the amount of memory used, drilling down on unified memory, and memory used by Python (when using PySpark). This is implemented using a new set of metrics called "
executor metrics", and can be helpful for memory sizing and troubleshooting performance.
Measuring memory usage and peak values using the REST API
An example of the data you can get from the
REST API in Spark 3.0:
WebUI URL + /api/v1/applications/<application_id>/executors
Here below you can find a snippet of the peak executor memory metrics, sampled on a snapshot and limited to one of the executors used for testing:
"peakMemoryMetrics" : {
    "JVMHeapMemory" : 29487812552,
    "JVMOffHeapMemory" : 149957200,
    "OnHeapExecutionMemory" : 12458956272,
    "OffHeapExecutionMemory" : 0,
    "OnHeapStorageMemory" : 83578970,
    "OffHeapStorageMemory" : 0,
    "OnHeapUnifiedMemory" : 12540212490,
    "OffHeapUnifiedMemory" : 0,
    "DirectPoolMemory" : 66809076,
    "MappedPoolMemory" : 0,
    "ProcessTreeJVMVMemory" : 38084534272,
    "ProcessTreeJVMRSSMemory" : 36998328320,
    "ProcessTreePythonVMemory" : 0,
    "ProcessTreePythonRSSMemory" : 0,
    "ProcessTreeOtherVMemory" : 0,
    "ProcessTreeOtherRSSMemory" : 0,
    "MinorGCCount" : 561,
    "MinorGCTime" : 49918,
    "MajorGCCount" : 0,
    "MajorGCTime" : 0
  },
Notes:
- Procfs metrics (SPARK-24958) provide a view on the process usage from "the OS point of observation".
- Notably, procfs metrics provide a way to measure memory usage by Python, when using PySpark and in general other processes that may be spawned by Spark tasks.
- Profs metrics are gathered conditionally:
- if the /proc filesystem exists
- if spark.executor.processTreeMetrics.enabled=true
- The optional configuration spark.executor.metrics.pollingInterval allows to gather executor metrics at high frequency, see doc.
- Additional improvements of the memory instrumentation via REST API (targeting Spark 3.1) are in "SPARK-23431 Expose the new executor memory metrics at the stage level".
Improvements to the Spark metrics system and Spark performance dashboard
Some of the advantages of collecting metrics values and visualizing them with Grafana are:
- The possibility to see the evolution of the metrics values in real time and to compare them with other key metrics of the workload.
- Metrics can be examined as aggregated values or drilled down at the executor level. This allows you to understand if there are outliers or stragglers.
- It is possible to study the evolution of the metrics values with time and understand which part of the workload has generated certain spikes in a given metric, for example. It is also possible to annotate the dashboard graphs, as explained at this link, with details of query id, job id, and stage id.
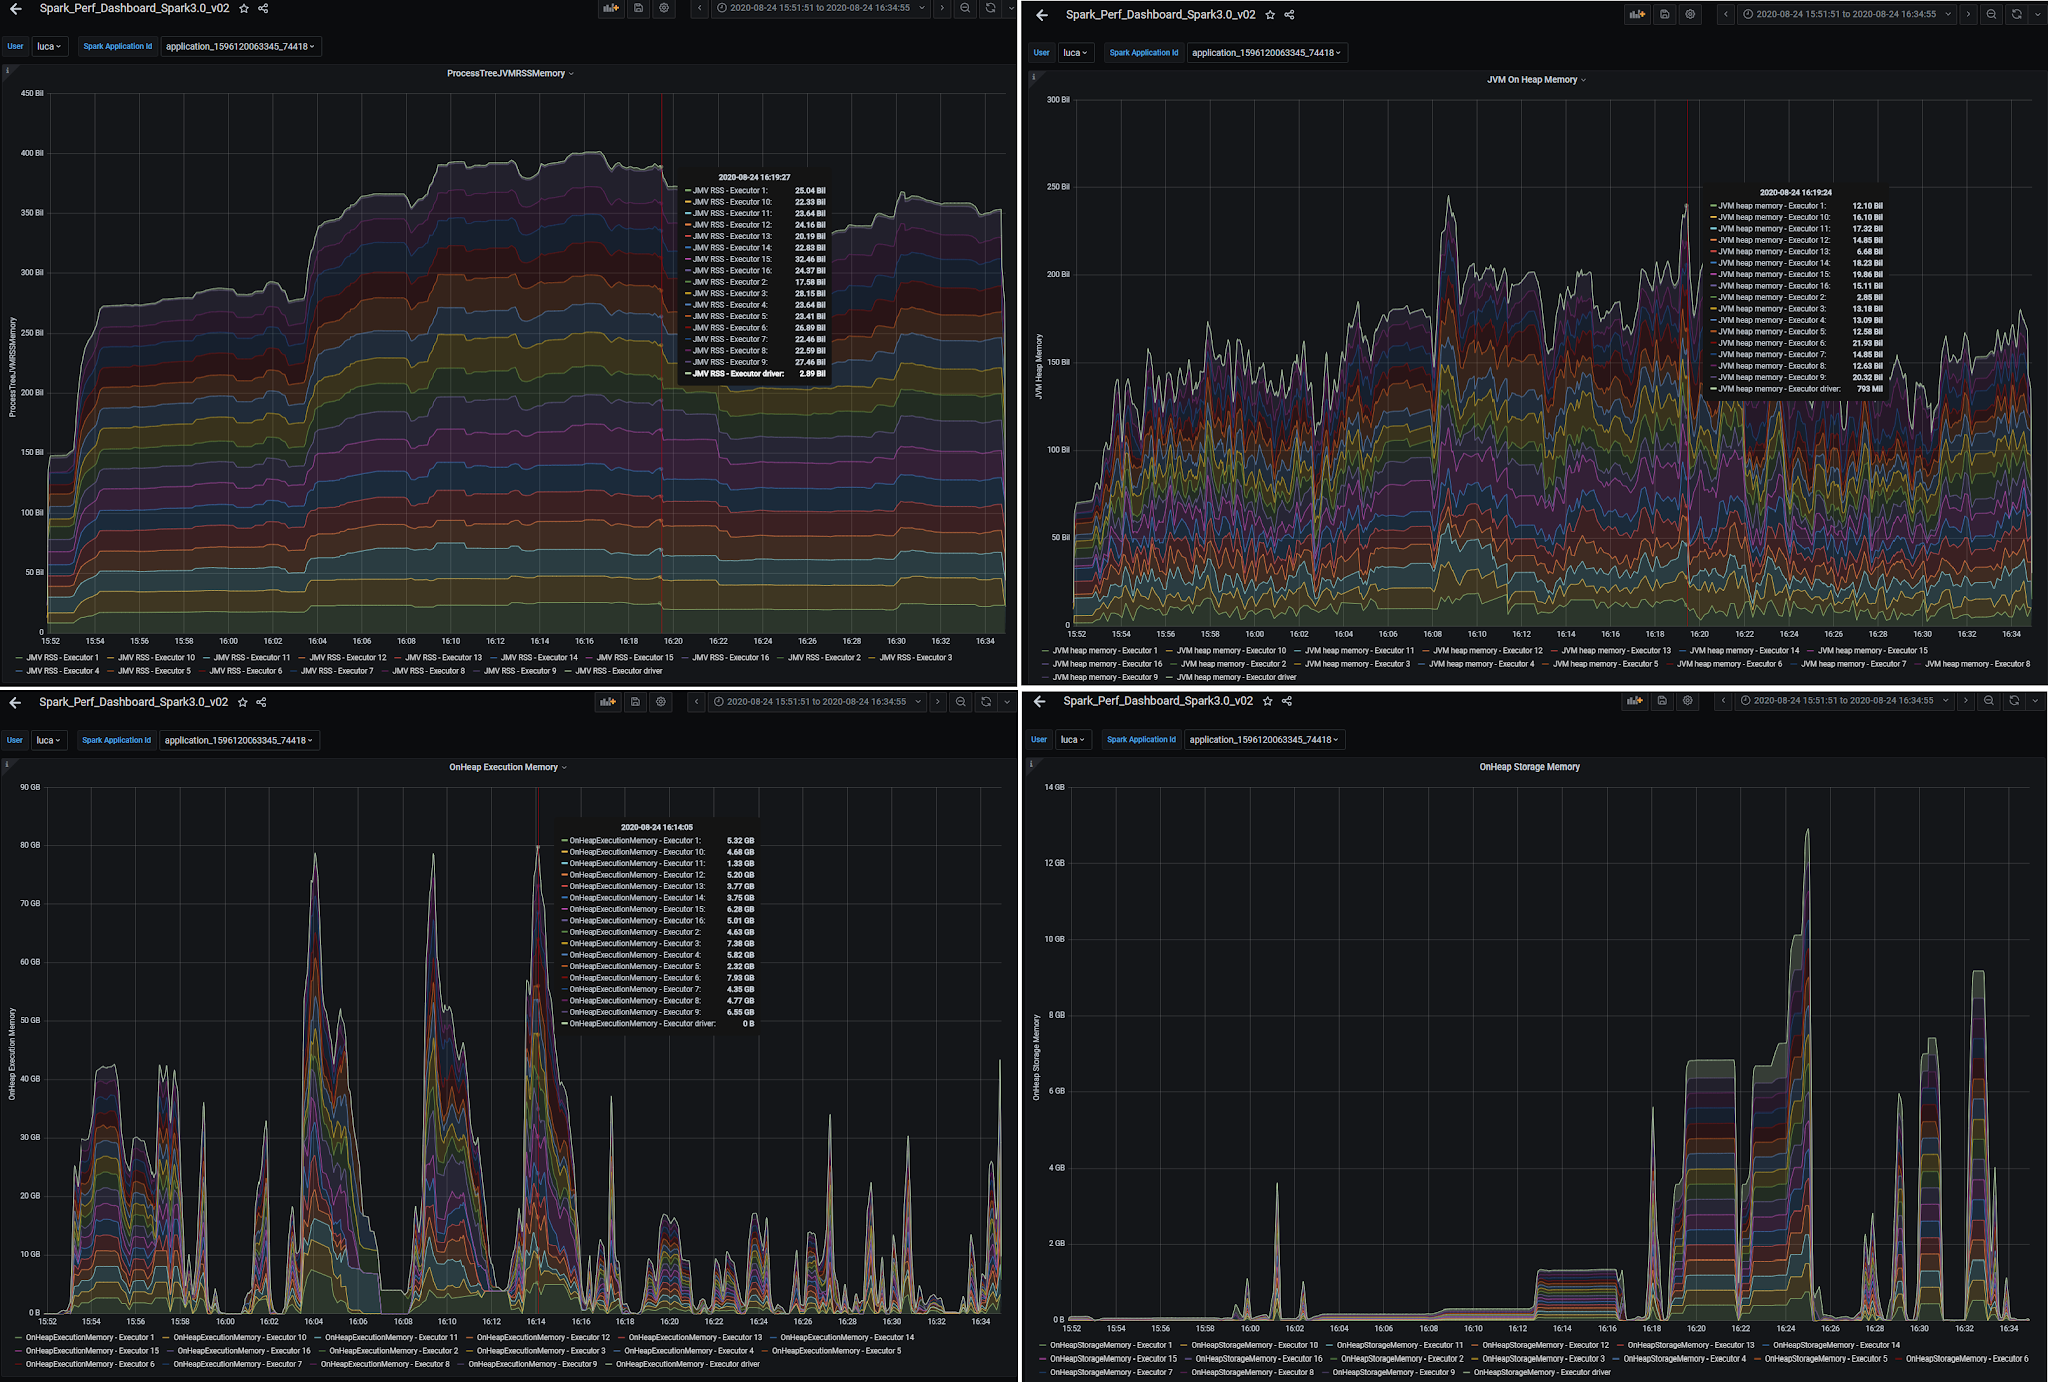
Here are a few examples of dashboard graphs related to memory usage:
Figure 2: Graphs of memory-related metrics collected and visualized using a
Spark performance dashboard. Metrics reported in the figure are: Java heap memory, RSS memory, Execution memory, and Storage memory. The Grafana dashboard allows us to drill down on the metrics values per executor. These types of plots can be used to study the time evolution of key metrics.
What if you are using Spark 2.x?
Some monitoring features related to memory usage are already available in Spark 2.x and still useful in Spark 3.0:
- Task metrics are available in the REST API and in the dropwizard-based metrics and provide information:
- Garbage Collection time: when garbage collection takes a significant amount of time typically you want to investigate for the need for allocating more memory (or reducing memory usage).
- Shuffle-related metrics: memory can prevent some shuffle operations with I/O to storage and be beneficial for performance.
- Task peak execution memory metric.
- The WebUI reports storage memory usage per executor.
- Spark dropwizard-based metrics system provides a JVM source with memory-related utilization metrics.
Lab configuration:
When experimenting and trying to get a grasp for the many parameters related to memory and monitoring, I found it useful to set up a small test workload. Some notes on the setup I used:
bin/spark-shell --master yarn --num-executors 16 --executor-cores 8 \
--driver-memory 4g --executor-memory 32g \
--jars /home/luca/spark-sql-perf/target/scala-2.12/spark-sql-perf_2.12-0.5.1-SNAPSHOT.jar \
--conf spark.eventLog.enabled=false \
--conf spark.sql.shuffle.partitions=512 \
--conf spark.sql.autoBroadcastJoinThreshold=100000000 \
--conf spark.executor.processTreeMetrics.enabled=true
import com.databricks.spark.sql.perf.tpcds.TPCDSTables
val tables = new TPCDSTables(spark.sqlContext, "/home/luca/tpcds-kit/tools","1500")
tables.createTemporaryTables("/project/spark/TPCDS/tpcds_1500_parquet_1.10.1", "parquet")
val tpcds = new com.databricks.spark.sql.perf.tpcds.TPCDS(spark.sqlContext)
val experiment = tpcds.runExperiment(tpcds.tpcds2_4Queries)
Limitations and caveats
- Spark metrics and instrumentation are still an area in active development. There is room for improvement both in their implementation and documentation. I found that some of the metrics may be difficult to understand or may present what looks like strange behaviors in some circumstances. In general, more testing and sharing experience between Spark users may be highly beneficial for further improving Spark instrumentation.
- The tools and methods discussed here are based on metrics, they are reactive by nature, suitable for troubleshooting and iterative experimentation.
- This post is centered on describing Spark 3.0 new features for memory monitoring and how you can experiment with them. A key piece left for future work is to show some real-world examples of troubleshooting using memory metrics and instrumentation.
- For the scope of this post, we assume that the workload to troubleshoot is a black box and that we just want to try to optimize the memory allocation and use. This post does not cover techniques to improve the memory footprint of Spark jobs, however, they are very important for correctly using Spark. Examples of techniques that are useful in this area are: implementing the correct partitioning scheme for the data and operations, reducing partition skew, using the appropriate join mechanisms, streamlining caching, and many others, covered elsewhere.
References
Talks:
Spark documentation and blogs:
Conclusions and acknowledgments
It is important to correctly size memory configurations for Spark applications. This improves performance, stability, and resource utilization in multi-tenant environments. Spark 3.0 has important improvements to memory monitoring instrumentation. The analysis of peak memory usage, and of memory use broken down by area and plotted as a function of time, provide important insights for troubleshooting OOM errors and for Spark job memory sizing.
Many thanks to the Apache Spark community, and in particular the committers and reviewers who have helped with the improvements in
SPARK-27189.
This work has been developed in the context of the data analytics services at CERN, many thanks to my colleagues for help and suggestions.


